目录
1. 案例:
2. 原因:
3. 解决:
1. 案例:
默认是正常宽度(如图1),当再次跳转会该页面时,eachars图发生变化(如图2)。
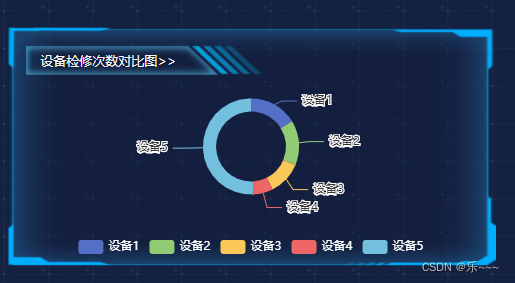
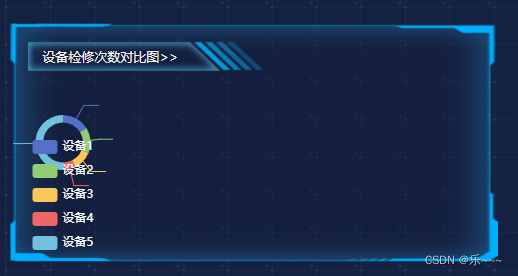
2. 原因:
没有给eachars添加自适应。
3. 解决:
在父组件中:
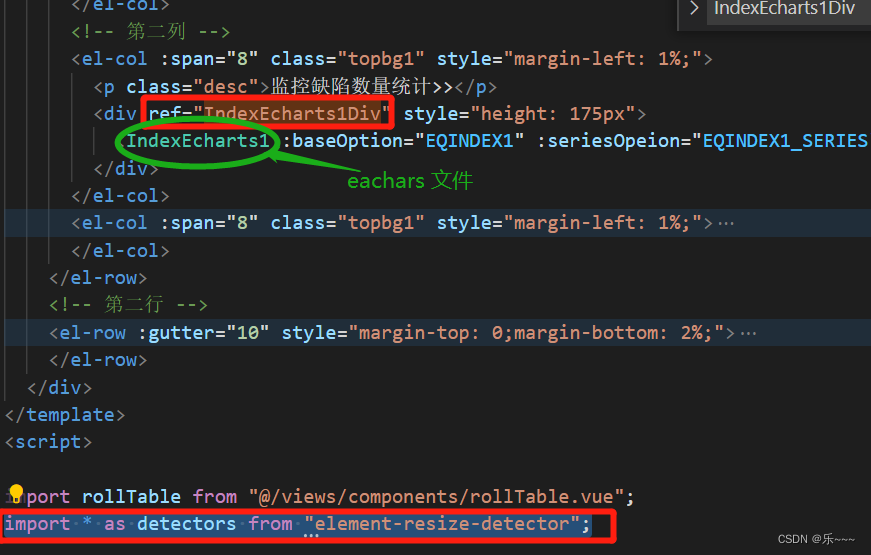
第一步:给包eachars的div 添加 ref="refName",引用依赖,如图3所示;
第二步:监听div大小的变化,从而实时计算后的宽、高(看下面的代码),并把值传给子组件(IndexEcharts1.vue)
在子组件中:直接看代码
父组件:
javascript">mounted(){
  this.GetEqOutView();

};
methods:{
GetEqOutView() {
      var elementResizeDetectorMaker = detectors
      // 创建实例,无参数
      var erd = elementResizeDetectorMaker();
      // 创建实例带参数
      var erdUltraFast = elementResizeDetectorMaker({
        strategy: "scroll",
        callOnAdd: true,
        debug: true
      });
      //监听id为test的元素 大小变化
      erd.listenTo(this.$refs.IndexEcharts1Div, (element) => {
        this.widthAndheight = {
          width: element.offsetWidth + "px",
          height: element.offsetHeight + "px",
        }
        // debugger
        console.log('实时计算后的宽、高 :::', this.widthAndheight.width, '------', this.widthAndheight.height, '-----------------');
        this.EQINDEX1 = {
          backgroundColor: "transparent",
          tooltip: {
            trigger: "axis",
            axisPointer: {
              type: "cross",
              label: {
                backgroundColor: "#6a7985",
              },
            },
          },
          // 调整位置
          grid: {
            top: "0%",
            left: "4%",
            right: "4%",
            bottom: "4%",
            containLabel: true,
          },
          textStyle: {
            color: "#ffffff",
          },
          xAxis: [
            {
              type: "category",
              boundaryGap: false,
              axisTick: {
                inside: true,
                lineStyle: {
                  color: "#1868a9",
                },
              },
              axisLine: {
                lineStyle: {
                  color: "#1868a9",
                },
              },
              data: [
                "1月",
                "2月",
                "3月",
                "4月",
                "5月",
                "6月",
                "7月",
                "8月",
                "9月",
                "10月",
                "11月",
                "12月",
              ],
            },
          ],
          yAxis: [
            {
              type: "value",
              splitLine: {
                lineStyle: {
                  color: "#1868a9",
                },
              },
              axisLabel: {
                inside: true,
                verticalAlign: "bottom",
                formatter: function (value) {
                  return value + "次";
                },
              },
            },
          ],
          lineStyle: {
            normal: {
              color: "#31ad6b", // 线条颜色
            },
          },
        };
        this.EQINDEX1_SERIES = {
          series: [
            {
              name: "本年度",
              type: "line",
              smooth: true,
              lineStyle: {
                normal: {
                  color: "#31ad6b", // 线条颜色
                },
              },
              areaStyle: {
                //区域填充样式
                normal: {
                  //线性渐变,前4个参数分别是x0,y0,x2,y2(范围0~1);相当于图形包围盒中的百分比。如果最后一个参数是‘true’,则该四个值是绝对像素位置。
                  color: new this.$echarts.graphic.LinearGradient(
                    0,
                    0,
                    0,
                    1,
                    [
                      { offset: 0, color: "#58ce8f" },
                      { offset: 0.7, color: "rgba(61,234,255, 0)" },
                    ],
                    false
                  ),

                  shadowColor: "rgba(53,142,215, 0.9)", //阴影颜色
                  shadowBlur: 20, //shadowBlur设图形阴影的模糊大小。配合shadowColor,shadowOffsetX/Y, 设置图形的阴影效果。
                },
              },
              symbol: "none",
              data: [120, 132, 101, 134, 90, 230, 210, 155, 201, 185, 135, 160],
            },
          ],
        }
      });

    },
}
子组件:
<template>
<div ref="init" id="left_top" :style="{
    'width': `${width}`,
    'height': '100%'
  }"></div>
</template>
<script>

export default {
  data() {
    return {
      m2R2Data: [],
      width: '',
      height: '',
      main: '',
    };
  },
  //父组件传过来的数据
  props: {
    seriesOpeion: [Array, Object],
    baseOption: [Array, Object],
    widthAndheight: [Array, Object]
  },
  computed: {
    changeData() {
      const { baseOption, seriesOpeion, widthAndheight } = this;
      return { baseOption, seriesOpeion, widthAndheight };
    },
  },
  created() {
  },
  mounted() {
    // 动态获取
    // this.height = window.getComputedStyle(this.$refs.init).height
    // this.width = window.getComputedStyle(this.$refs.init).width
    // debugger

    // this.$nextTick(() => {// 直接导入使用,也可以在main.js中引入
    //   var elementResizeDetectorMaker = detectors
    //   // 创建实例,无参数
    //   var erd = elementResizeDetectorMaker();
    //   // 创建实例带参数
    //   var erdUltraFast = elementResizeDetectorMaker({
    //     strategy: "scroll",
    //     callOnAdd: true,
    //     debug: true
    //   });
    //   //监听id为test的元素 大小变化
    //   erd.listenTo(this.$refs.init, (element) => {
    //     this.width = element.offsetWidth + "px";
    //     this.height = element.offsetHeight + "px";
    //   });
    // })
  },
  watch: {
    //#region 宽度
    // width: {
    //   handler(n, o) {
    //     if (this.myChars !== null) {
    //       // debugger

    //       // this.initData();
    //       // this.myChars.resize();
    //       // this.myChars.resize();
    //     }
    //   },
    // },
    //#endregion
    changeData(val) {
      // debugger
      this.width = val.widthAndheight.width
      this.height = val.widthAndheight.height
      console.log('父级传递宽度', val.widthAndheight.width, '------', val.widthAndheight.height)
      this.main = this.$refs.init;
      this.myChars = this.$echarts.init(this.main); //markRaw(this.$echarts.init(this.main)); //this.$echarts.init(this.main);
      this.SetEchars(val.baseOption, val.seriesOpeion);

      this.$nextTick(() => {
        this.myChars.resize()
      })
    },
  },
  methods: {
    //#region 旧
    init() {
      let _this = this;
      let res = {
        code: "200",
        msg: "查询成功",
        m2R2Data: [
          {
            value: 20,
            legendname: "油箱",
            name: "油箱",
            itemStyle: { color: "#ff5252" },
          },
          {
            value: 20,
            legendname: "油滤",
            name: "油滤",
            itemStyle: { color: "#ffac52" },
          },
          {
            value: 20,
            legendname: " 发动机",
            name: "发动机",
            itemStyle: { color: "#21b8ff" },
          },
        ],
      };
      // console.log("饼图数据=", res);
      _this.m2R2Data = res.m2R2Data;
      this.initData();
    },
    initData() {
      this.main = this.$refs.init//document.getElementById("left_top");

      this.myChars = this.$echarts.init(this.main);
      var option;
      option = {
        backgroundColor: "transparent",
        tooltip: {
          trigger: "axis",
          axisPointer: {
            type: "cross",
            label: {
              backgroundColor: "#6a7985",
            },
          },
        },
        // 调整位置
        grid: {
          top: "0%",
          left: "4%",
          right: "4%",
          bottom: "4%",
          containLabel: true,
        },
        textStyle: {
          color: "#ffffff",
        },
        xAxis: [
          {
            type: "category",
            boundaryGap: false,
            axisTick: {
              inside: true,
              lineStyle: {
                color: "#1868a9",
              },
            },
            axisLine: {
              lineStyle: {
                color: "#1868a9",
              },
            },
            data: [
              "1月",
              "2月",
              "3月",
              "4月",
              "5月",
              "6月",
              "7月",
              "8月",
              "9月",
              "10月",
              "11月",
              "12月",
            ],
          },
        ],
        yAxis: [
          {
            type: "value",
            splitLine: {
              lineStyle: {
                color: "#1868a9",
              },
            },
            axisLabel: {
              inside: true,
              verticalAlign: "bottom",
              formatter: function (value) {
                return value + "次";
              },
            },
          },
        ],
        lineStyle: {
          normal: {
            color: "#31ad6b", // 线条颜色
          },
        },
        series: [
          {
            name: "本年度",
            type: "line",
            smooth: true,
            lineStyle: {
              normal: {
                color: "#31ad6b", // 线条颜色
              },
            },
            areaStyle: {
              //区域填充样式
              normal: {
                //线性渐变,前4个参数分别是x0,y0,x2,y2(范围0~1);相当于图形包围盒中的百分比。如果最后一个参数是‘true’,则该四个值是绝对像素位置。
                color: new this.$echarts.graphic.LinearGradient(
                  0,
                  0,
                  0,
                  1,
                  [
                    { offset: 0, color: "#58ce8f" },
                    { offset: 0.7, color: "rgba(61,234,255, 0)" },
                  ],
                  false
                ),

                shadowColor: "rgba(53,142,215, 0.9)", //阴影颜色
                shadowBlur: 20, //shadowBlur设图形阴影的模糊大小。配合shadowColor,shadowOffsetX/Y, 设置图形的阴影效果。
              },
            },
            symbol: "none",
            data: [120, 132, 101, 134, 90, 230, 210, 155, 201, 185, 135, 160],
          },
        ],
      };
      option && this.myChars.setOption(option, true);
      // window.addEventListener("resize", function () {
      //   _this.myChars.resize(); //图表自适应的一个方法
      // });
    },
    //#endregion
    SetEchars(bOp, sOp) {
      console.log("进入SetEchars方法");
      this.options = Object.assign(bOp, sOp);
      this.myChars.setOption(this.options, true);
    },
  },


};
</script>
<style scoped>
.eachar01 {
  height: 100%;
}
</style>
ps:这些值是要在先定义的:
EQINDEX1: {},
EQINDEX1_SERIES: {},
widthAndheight: {},